DataDog vs. AWS CloudWatch: Choosing the Best Observability Tool
Observability is the process of understanding complex systems by analysing their outcomes and enhancing those outcomes by monitoring events within the system. Today, observability is essential for IT services to achieve a better user experience and optimise software performance.
With the dominance of cloud platforms in the IT services landscape, organizations are inclined to deploy their software and hardware systems in the cloud to reduce operational costs and enhance flexibility. Consequently, the demand for cloud-based observability tools has risen, encompassing Application Performance Monitoring, Infrastructure Monitoring, Network Monitoring, Security Monitoring, Log Management, Incident Monitoring, and more.
Despite the multitude of software observability tools available, DataDog and AWS CloudWatch stand out as the most preferred tools in the software community. In this blog, we will explore the features and key differences between DataDog and AWS CloudWatch."
Table of Contents
Introduction
Overview of DataDog and AWS CloudWatch
Comparison of Features Between Datadog and AWS CloudWatch
Choosing DataDog and AWS CloudWatch
Conclusion
Overview of DataDog and AWS CloudWatch
Datadog and AWS CloudWatch are widely utilised monitoring and observability platforms within cloud environments, distinguished by variances in their feature sets, integrations, and pricing structures.
Datadog stands as a robust platform catering to developers, IT operations teams, security engineers, and business users in the realm of cloud computing. With its comprehensive suite of tools, Datadog excels in effectively monitoring servers, tools, and databases.
In contrast, Amazon CloudWatch, nestled within the Amazon Web Services (AWS) ecosystem, extends its reach beyond AWS to observe and monitor resources and applications across diverse environments, including on-premises setups and other cloud providers.
While Datadog emphasizes infrastructure monitoring and offers seamless integration across application performance, infrastructure, logs, and user experience, Amazon CloudWatch focuses on monitoring applications, responding to performance variations, optimizing resource utilization, and providing insights into operational health.
✅ - Available
❎ - Not Available
🔴 - Limited
Comparison of Features Between Datadog and AWS CloudWatch:
Datadog
Datadog's SaaS-based infrastructure monitoring service includes metrics, visualisations, and alerts to help your engineering teams maintain, optimise, and secure your cloud or hybrid systems.
With comprehensive coverage of popular technologies, a straightforward deployment method that requires little maintenance, an easy-to-use interface, and deep security insights, Datadog improves team communication and troubleshooting.
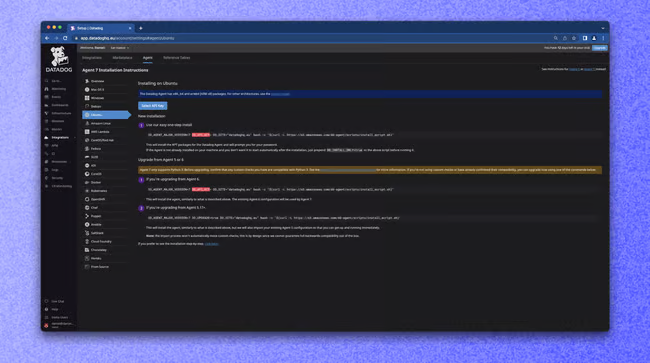
To use Datadog's infrastructure monitoring, an agent must be set up and executed. The Datadog agent is downloaded during initial setup when Datadog offers you pre-configured code for your infrastructure and critical configurations such as your API key, which is required to submit data to Datadog.
AWS CloudWatch
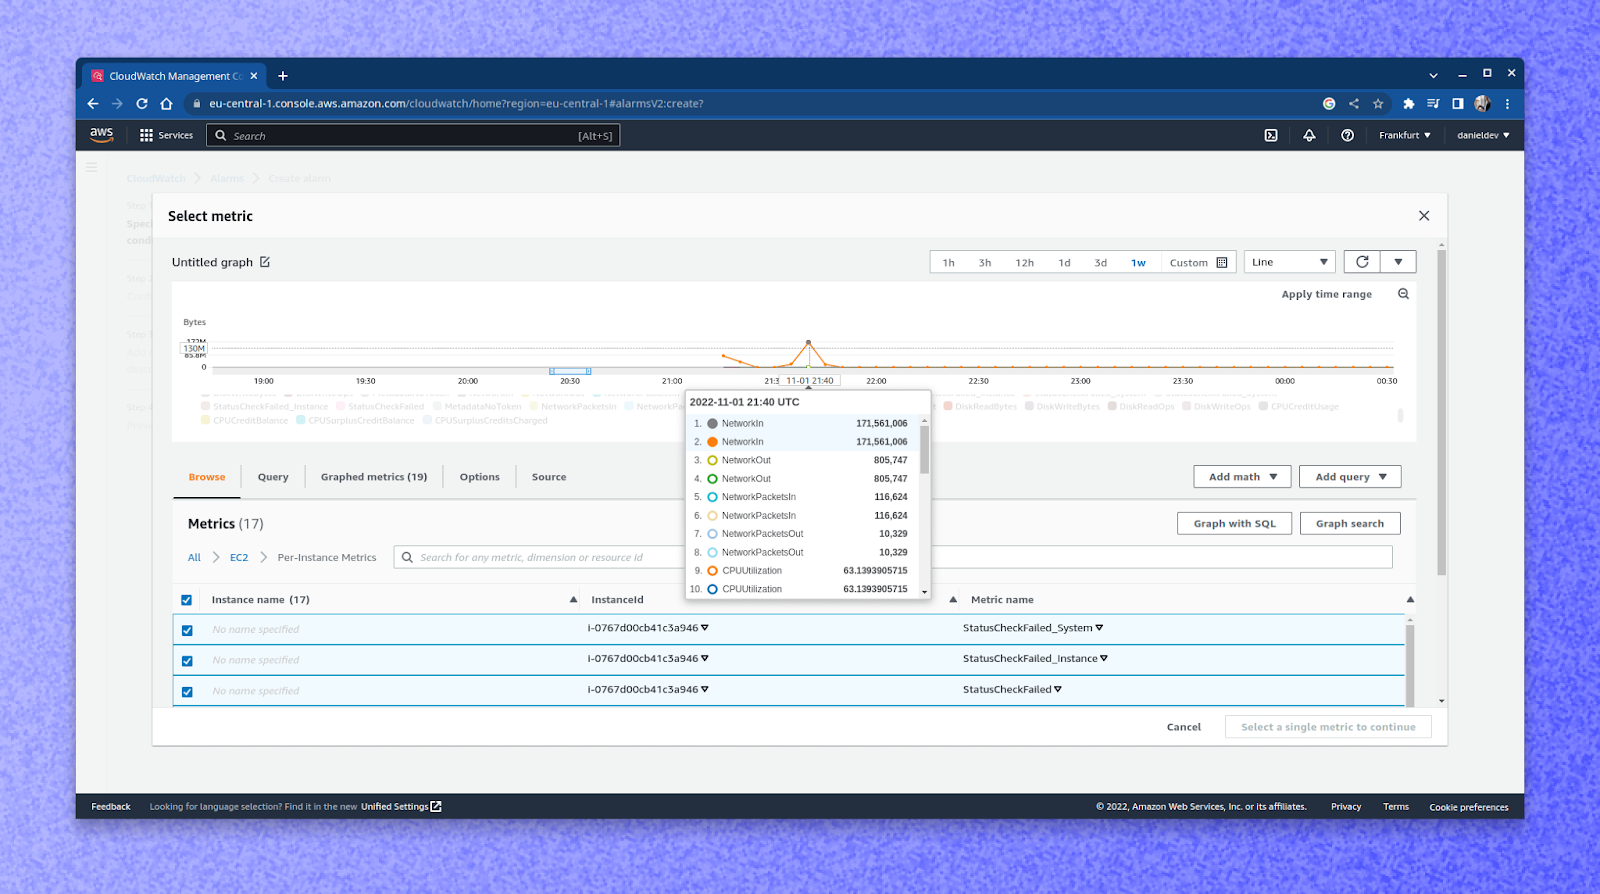
On the other hand, AWS CloudWatch provides basic infrastructure monitoring for AWS resources including EC2 instances, RDS databases, and Lambda functions, complete with metrics and alarms.
Typically, CloudWatch gathers fundamental metrics by default and promptly showcases them on the CloudWatch dashboard. Nevertheless, you have the option to install the amazon-cloudwatch-agent to broaden the scope of collected data.
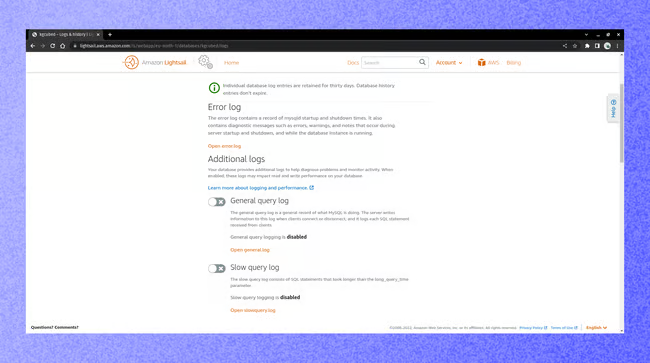
Log Management
DataDog
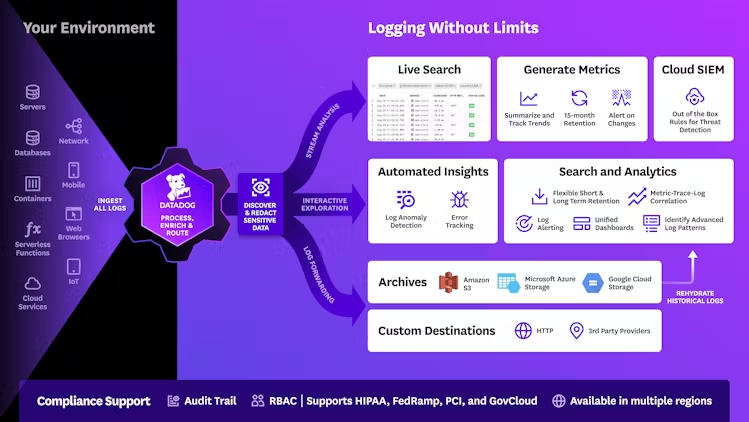
Datadog provides centralised log management together with alerting, parsing, indexing, search, and visualisation features for logs. Enabling log management in Datadog is simple.
Simply navigate to /etc/datadog-agent/datadog.yaml and turn on log collecting. Next, set up process-specific configuration files such as /conf.d/apache.d/conf.yaml to begin log capture. All required configuration files and code are accessible on Datadog's GitHub site. To complete the operation, make sure to monitor your intake quotas.
AWS CloudWatch
Conversely, AWS CloudWatch offers basic log aggregation, searching, and monitoring for AWS resources, but lacks some advanced log analysis capabilities. Setting up log management in CloudWatch is relatively simple.
In most cases, logs are automatically collected by default. However, you have the option to customise log collection settings using the respective service's UI. Additionally, you can utilize the CloudWatch agent to specify which logs and metrics to gather. This process requires an IAM-role account with service access.
DataDog
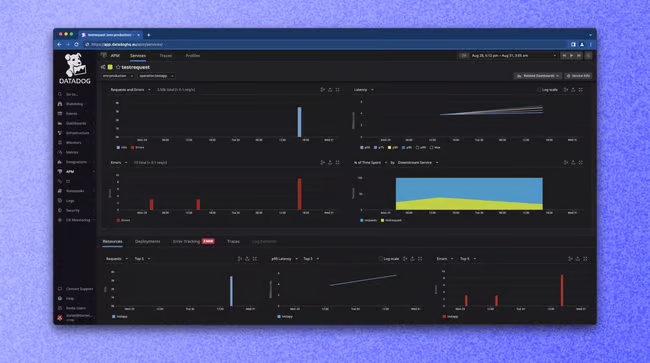
Datadog provides extensive APM capabilities for monitoring application performance, tracking requests, finding bottlenecks, and optimising code. Datadog's APM can be used with either a dedicated collector agent like dd-trace for Python or through instrumentation with OpenTelemetry.
Instrumenting Datadog is straightforward, and any issues can be resolved through documentation, courses, or GitHub resources. Datadog also offers a Getting Started wizard for each language, simplifying the process of pre-configuring scripts for agent invocation and metric collection.
AWS CloudWatch
Alternatively, Amazon CloudWatch offers restricted APM features via Amazon CloudWatch Application Insights, mainly for AWS services and resources. AWS employs AWS X-Ray to gather and analyze traces from applications, seamlessly incorporated into the CloudWatch UI.
CloudWatch presents a potent Application Performance Monitoring (APM) suite featuring ServiceLens, Resource Health, Synthetic Canaries, RUM, and Evidently. CloudWatch offers a convenient trial setup for testing APM capabilities, particularly advantageous for those new to AWS.
Through Evidently, an integral part of its infrastructure, CloudWatch facilitates deploying and testing new features selectively before full release, ensuring thorough data collection and informed decision-making.
DataDog
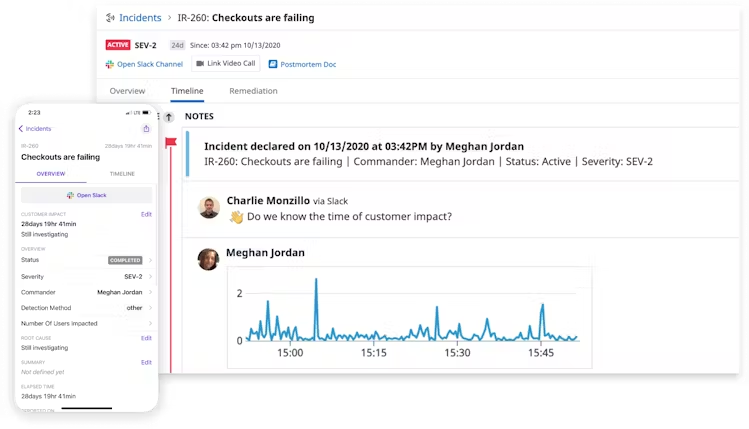
DataDog offers incident management capabilities that streamline problem response, on-call scheduling, escalation policies, and collaboration by integrating with collaboration platforms.
In Datadog's interface, you can generate monitors and report incidents from diverse tools. You're able to specify incident particulars, including assigning responsibilities, attaching video call links, determining severity levels, and triggering notifications. Additionally, Datadog's notebooks serve as a platform for drafting postmortems, enabling the storage of crucial incident details.
AWS CloudWatch
In contrast, AWS CloudWatch does not have incident management functionality, however, it interfaces with other AWS services such as AWS Systems Manager for operational chores.
CloudWatch provides some basic alerting tools, but for a full-fledged Incident Detection and Response system, you'll need an Enterprise support plan on AWS and an extra monthly charge.
Multi-Cloud Support
DataDog
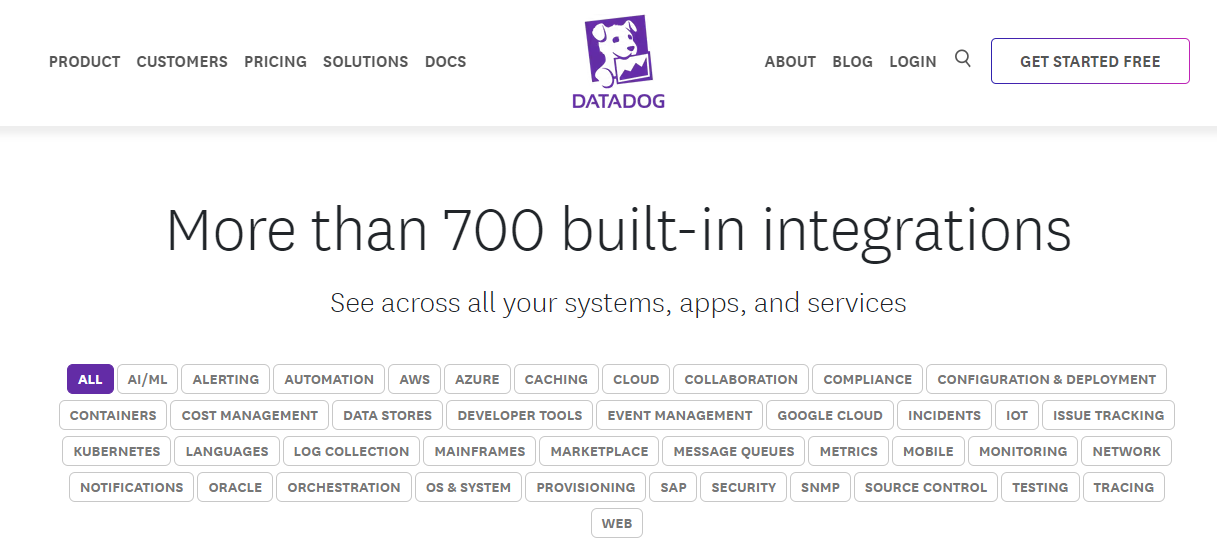
DataDog is a third-party monitoring service with multiple cloud providers, including AWS, Azure, and Google Cloud Platform. It also supports on-premises and hybrid environment monitoring.
Almost 700 different technologies, services, and platforms are integrated into Datadog's vast integration ecosystem.
AWS CloudWatch
Nevertheless, AWS CloudWatch is strongly created for only AWS services. Although it can enable certain hybrid and on-premises monitoring, its native integration works best within the AWS ecosystem.
Ease of Use and User Interface
DataDog
DataDog is Known for its easy-to-use UI, customisable dashboards, and comprehensive integration library. It frequently requires minimal setting and offers a diverse set of visualisation choices.
Setting up a datadog could be challenging at first. The tool will be more practical after you are familiar with its usage and the surrounding conditions. Fortunately, each tool comes with a Getting Started wizard page that walks you through the necessary procedures and provides connections to other sections of the documentation.
AWS CloudWatch
On the other hand, AWS CloudWatch is integrated into the AWS Management Console and provides customers with a native experience. It may be perceived as smooth by organisations with significant investment in AWS services.
The CloudWatch UI offers a user-friendly "Get Started" page with links to its features like Alarms, Logs, Metrics, and Traces. These are conveniently accessible via a side panel, with toggle headings enabling easy navigation. The UI is both practical and technical.
Pricing Model
DataDog
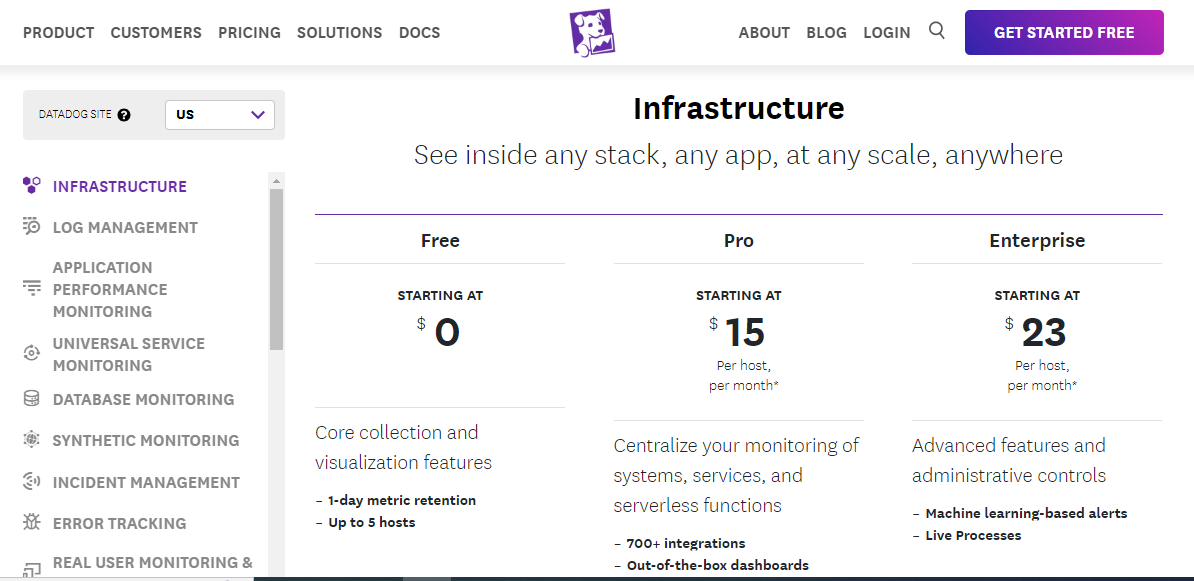
DataDog uses a subscription-based pricing mechanism; the price may vary based on the number of hosts or other criteria that are kept track of. As an example, the cost for Datadog starts at approximately $15 per user per month, while the Enterprise version for infrastructure monitoring is priced at $23.
AWS CloudWatch
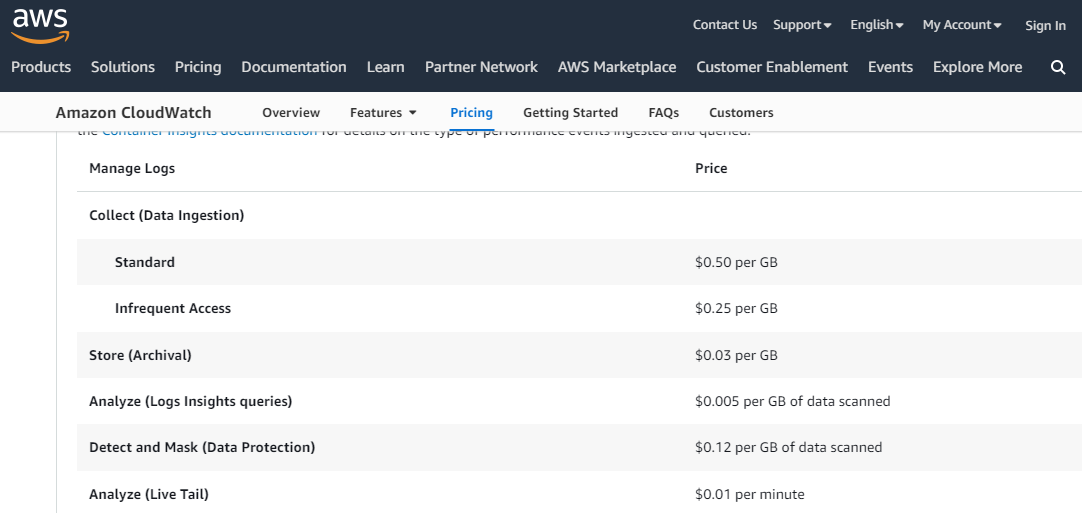
However, AWS CloudWatch includes a pay-as-you-go pricing plan in which customers are charged according to the amount of data they use, the number of API queries they make, and other criteria. Usually, EC2 Detailed Monitoring incurs a fee of $2.10 per instance per month (based on 7 metrics per instance), gradually decreasing to $0.14 per instance at the lowest tier. When it comes to pricing, AWS CloudWatch outperforms Datadog.
Choosing DataDog and AWS CloudWatch
The choice between DataDog and AWS CloudWatch is based on your requirements and your infrastructure type. If you work in a multi-cloud environment or have a combination of on-premises and cloud-based components, DataDog's multi-cloud support may be useful. It is well-known for its user-friendly interface, customisable dashboards, and broad compatibility with numerous technologies.
On the other hand, if your infrastructure is heavily reliant on AWS services, AWS CloudWatch could be a seamless and cost-effective option. Its natural connectivity with the AWS environment, pay-as-you-go pricing, and simplicity for AWS users make it an easy-to-use monitoring solution.
Consider your budget, the specific capabilities you desire, and your team's expertise with AWS services. If you're working in a hybrid environment, it's important to compare both options to see which one best meets your individual needs. Check for upgrades or new features in both systems as the technology landscape changes over time. Ultimately, the best option is determined by your organisation's specific circumstances and priorities.
Conclusion
IT teams are under more pressure than ever to monitor and address conditions and issues across their multi-cloud environments as dynamic systems designs grow in complexity and scale. IT operations, DevOps, and SRE teams therefore desire more observability of these progressively complex and heterogeneous computing environments.
Amazon CloudWatch and Datadog are cloud monitoring services that offer enterprises real-time data and insights into their applications and systems. While they have comparable functions, there are several major differences between the two platforms that can help organisations decide which one is ideal for their purposes.


Comments
Post a Comment