OpenTelemetry vs OpenTracing: Which is Better for Instrumentation
As software products transition from monolithic to distributed microservice architectures, monitoring and observability have risen. While observability and application monitoring have similar definitions, they also differ in significant ways.
Finding problems in an application is the goal of both monitoring and observability. Monitoring, however, tries to record issues that are already recognised and display them on a dashboard so that users can understand their cause and the moment at which they happened.
Contrarily, observability adopts a much more low-level strategy, requiring developers to debug the code to comprehend the internal state of an application. Hence, observability is the most recent advancement in application monitoring that aids in discovering unidentified troubles.
A system needs to be instrumented to be observable, which entails that the components' code must output traces, metrics, and logs. Traces, metrics, and logs (telemetry data) collection and presentation are now much more challenging than in monolithic systems as a result of the level of administration complexity that distributed systems have introduced.
You care about the functionality of your applications as a developer, and you are aware of how difficult it may be to find the appropriate instrumentation to gather telemetry data. Telemetry data is now essential to give technologists a complete picture of app usage and performance. The issue lies in collecting such data from numerous different platforms. In this article, we'll discuss software that is suitable for gathering telemetry data for monitoring and observability to enhance the functionality of your app.
Before that, let's learn some jargon to effectively grasp the topic.
Distributed tracing
A distributed tracing tool is a piece of software used to monitor the operation and behaviour of complicated distributed systems, like applications built using microservices. With the aid of distributed tracing, you can observe how a request moves through several services and systems, the timing of each action, any logs, and errors as they arise.
Software Observability
The method by which a system's internal states can be deduced from the understanding of its external outputs is known as observability in engineering.
Telemetry, the reading and recording of instruments, can be used to increase the software's observability. This involves gathering and analysing data from parts and extra measurement software in the context of infrastructure and applications. But, if you're building your instrumentation code or utilising open-source tools or libraries, you can also manually add telemetry to the code. Observability is made possible by three pillars - Logs, metrics, and traces.
Metrics show that there is a problem.
Traces point out the problem's location.
Logs aid in root-cause analysis
Instrumentation
A method that is frequently used in software profiling, performance analysis, optimisation, testing, error detection, and virtualization is software instrumentation. Either statically (i.e., at compile time) or dynamically, instrumentation entails adding additional code to an application to monitor certain programme activity (i.e., at runtime).
Telemetry data
Telemetry is the automatic process of remotely collecting the data generated by your systems using agents and protocols. Any logs, metrics, events, and traces that are produced by your applications are included in the scope of telemetry data. This data must be visualised and reported on without any gaps that could affect the precision of your troubleshooting or analysis.

OpenCensus
OpenCensus is a collection of libraries for several languages that let you gather distributed traces and application metrics before sending the information in real time to the backend of your choosing. Developers and administrators can examine this data to determine the condition of the programme and track down issues.
Let's get right to the point.
The open-source projects OpenTelemetry and OpenTracing are used to instrument application code for producing telemetry data. OpenTracing focuses on producing traces for distributed systems, whereas OpenTelemetry can assist you in producing logs, metrics, and traces.
If you're trying to pick between OpenTracing and OpenTelemetry, go with OpenTelemetry. Users of OpenTracing are encouraged to switch to OpenTelemetry as OpenTracing is currently deprecated.
Let's quickly review each technology before comparing how OpenTelemetry and OpenTracing vary from one another.
OpenTracing
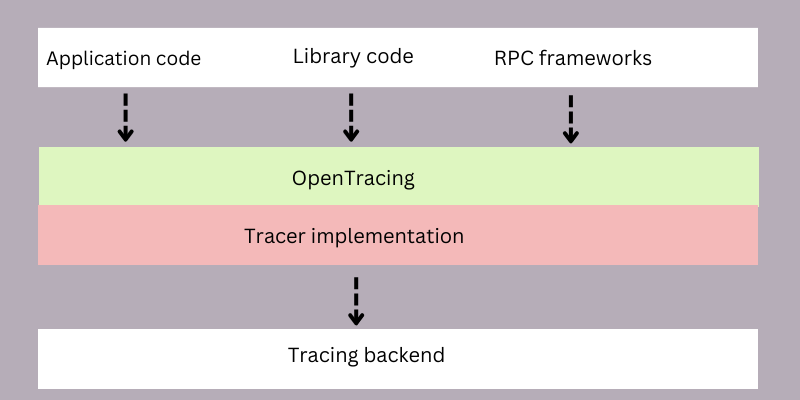
A project of the Cloud Native Computing Foundation (CNCF), OpenTracing was originally made available in December 2016. It is a semantic description of a vendor-independent API for creating distributed tracing. It supports libraries in nine languages, each with an easy-to-use interface for instrumenting code so that it may be traced by any vendor or project that offers an OpenTracing-compatible tracer in that language.
The request trace is broken down into time-based and hierarchical spans by the tracer. Developers can modify tracers without touching the codebase because OpenTracing separates the tracing layer from the application layer. They can also create their tracers.
Logs make it easier to comprehend what is occurring in an application. On the server where they are installed, the majority of programmes produce logs. However, they won't suffice for dispersed systems because it can be challenging to locate an issue with logs. Here, distributed tracing is useful since it keeps track of a request from beginning to end.
Although tracing makes dispersed programmes visible, instrumenting traces is a very time-consuming process. Every tracing tool that is now available functions uniquely and is continually changing. Also, multiple tools could be needed for various circumstances, therefore developers shouldn't be restricted to using just one tool for the duration of the software development process. In this situation, OpenTracing is useful.
Components of OpenTracing
The four main parts of OpenTracing are simple to comprehend. Which are:
Tracer
A Tracer is the starting point of the tracing API. Tracers are used to build spans. We can also use them to extract and send traces of information to and from outside sources.
Span
Spans are the main building block or a unit of work in a trace. Once you generate a web request that makes a fresh trace, known as “root span.” If that request starts another request in its workflow, the second request will be a child span. Span can support more complex workflows, even involving asynchronous messaging.
SpanContext
A serializable variant of a Span called SpanContext sends Span data across process boundaries. It includes baggage items, span id, and trace id.
References
References help connect spans. ChildOf and FollowsFrom are the names of two different sorts of references.
OpenTelemetry
OpenTelemetry = OpenTracing + OpenCensus
Being the sole standard for application instrumentation under CNCF, OpenTelemetry was created as a result of the combination of OpenTracing and OpenCensus. OpenTelemetry enhances and combines the features of OpenTracing and OpenCensus.
OpenTracing was solely dedicated to distributed tracing, whereas OpenTelemetry can be your one-stop shop for all types of telemetry data, including logs, metrics, and traces. Those who now utilise the OpenTracing APIs can switch to OpenTelemetry. OpenTracing and OpenTelemetry are backwards compatible.
The key benefit of OpenTelemetry is its observability, which may be defined as the capacity to track the internal health and state of any given system by concentrating on the data it generates by examining its metrics, traces, and logs.
Use the OpenTelemetry client libraries provided by the necessary programming language to include OpenTelemetry in your application code. To process and export telemetry data in various forms, OpenTelemetry also offers a collector by the name of OTel(OpenTelemetry) collector.
Components of OpenTelemetry
To comprehend how OpenTelemetry functions, you must be aware of its essential components.
API
With the use of APIs, you may instrument your application to produce traces, metrics, and logs. These language-specific APIs were created in a variety of languages, including Java,.Net, and Python.
SDK
The SDK serves as a liaison between the API and the Exporter, which is another language-specific component. It provides definitions for ideas like exporting, data processing, and configuration. The SDK is adept at handling request filtering and transaction sampling as well.
Collector
Telemetry data is gathered, processed, and exported by the collector. It serves as a vendor-independent proxy. It is useful since it can accept and deliver application telemetry data to the backend with significant flexibility, even though it is not a necessary component. For instance, if required, you can send data in numerous backends in multiple formats from OTLP, Jaeger, and Prometheus.
In-process exporter
The backend to which you want to send telemetry data can be set up using the Exporter. The instrumentation is separated from the backend settings by the exporter. Hence it's simple to change the backend without affecting the instrumentation.
How openTelemetry works?
OpenTelemetry offers a standard to give cloud-focused apps observability. Companies will save time since they won't have to devote their attention to developing systems for gathering application telemetry.
Communication between collectors and various back ends via exporters is the initial stage in OpenTelemetry.
Then, the collector will aggregate, batch, and process the data under how the collection is configured.
Following that, data is exchanged between the exporter and collector in the form of telemetry and is often sent as an in-process.
The subsequent phase is the requirement for processing extensions, which can be introduced by SDK and offers effects like filtering, sampling, and enrichments. There are situations when a different tool can take the place of the SDK. We must first examine the various OpenTelemetry components to fully comprehend this procedure.
OpenTelemetry VS OpenTracing
Both the open-source initiatives OpenTracing and OpenTelemetry aim to offer vendor-neutral solutions. OpenTelemetry, however, is the most recent solution produced by fusing OpenTracing and OpenCensus. It is therefore more durable than OpenTracing.
OpenTelemetry collects all sorts of telemetry data, including logs, metrics, and traces, whereas OpenTracing exclusively collects traces in distributed applications. Moreover, OpenTelemetry provides a set of frameworks, SDKs, and APIs that you may use right now. The flexibility of OpenTelemetry to instantly switch the backend used to process telemetry data is one of its key advantages.
OpenTelemetry is the better option if you're debating between it and OpenTracing. It is encouraged for users of OpenTracing to switch to OpenTelemetry as OpenTracing is currently deprecated.
Why we should choose OpenTelemetry for instrumentation?
Monitoring distributed systems means collecting data from various sources, including servers, containers, and applications. It can be challenging to obtain a holistic perspective of the performance of an organization's complete system in large enterprises when various teams may even employ different stacks and platforms adapted to their needs. OpenTelemetry streamlines your observability efforts by providing you with a single, global standard for gathering and sending telemetry data, making it simpler for teams to optimise performance and diagnose problems.
A few of OpenTelemetry's main advantages are:

Consistency
Before OpenTelemetry, it was possible to collect telemetry data from applications, but it was much more challenging. It was difficult to find the correct set of instruments, and if you decided on a particular vendor or solution, you were legally obligated to use just their products. It was virtually impossible to have a comprehensive grasp of an application's performance because that solution was unlikely to be constant from one application to another.
On the other hand, OpenTelemetry offers a de facto standard for adding observability to cloud-native apps by establishing a uniform method for telemetry data collection and transmission to a backend without modifying instrumentation. Instead of battling with their instrumentation, developers and IT can now spend more time designing new app features.
Easy option
Organizations had to decide between OpenTracing or OpenCensus, each of which offered a different strategy for obtaining observability, before OpenTelemetry. You get the best of both frameworks in a single solution since OpenTelemetry combines the codes of those two frameworks. And if you were previously using one or the other, moving to OpenTelemetry has no risk. Both are backwards-compatible with OpenTelemetry.
Improved observability
Developers can get application usage and performance data using any device or web browser thanks to OpenTelemetry. Real-time observability data tracking and analysis are simple with this practical interface.
Of course, gaining the observability required to meet corporate objectives is the main advantage. OpenTelemetry gathers the telemetry data required to assess system performance, identify potential performance-compromising issues, and address root causes, possibly before service is stopped. As a result, supporting business processes are more stable and reliable.
The End
OpenTelemetry is a software framework that combines OpenTracing and OpenCensus features. It aims to provide a selection of easily accessible frameworks for various languages. Hence, using OpenTelemetry, OpenTracing and OpenCensus may be easily relocated without requiring major modifications. There is a two-year timeframe for instrumentation with both OpenTracing and OpenCensus. During this period, each root project can be easily and quickly migrated using the compatibility bridges that are now available.
Until OpenTelemetry became the industry standard in 2019, telemetry data compilation and exporting were in the wild west. An offshoot of OpenTracing and OpenCensus, OpenTelemetry offers the connectors needed to link with backends and deliver telemetry data to your favourite data observability tools.
The observability environment is evolving due to OpenTelemetry. OpenTelemetry is rapidly gaining popularity for observability, much like Kubernetes did for container orchestration. The benefits of OpenTelemetry, which we've already discussed, will lead to an increase in both its adoption and recognition.
An engineer can easily add hooks to backends developed in languages that have only recently been utilised by implementing OpenTelemetry. With whole libraries and APIs prepared to make data collecting simple, the open-source community that supports the OpenTelemetry framework continuously develops compatibility with new backend technologies.
If you choose between OpenTelemetry and OpenTracing, OpenTelemetry is ultimately the superior choice. It is encouraged for users of OpenTracing to switch to OpenTelemetry as OpenTracing is currently deprecated.


Comments
Post a Comment