Prometheus Architecture Scalability: Challenges and Tools for Enhanced Solutions

After successfully deploying and implementing a software system, the subsequent task for an IT enterprise revolves around the crucial aspects of system monitoring and maintenance. An array of monitoring tools has been developed in alignment with the software system's evolution and requirements.
Monitoring tools for software systems provide the essential insights that IT teams require to comprehend the real-time and historical performance of their systems. This understanding empowers them to strategize actions for proficiently overseeing their networks, systems, and devices, enabling them to make informed decisions spanning both immediate and future contexts.
These tools encompass real-time monitoring, alerting and notification features, comprehensive dashboards for visualization, performance metrics assessment, log monitoring capabilities, scalability evaluation, network oversight, application performance tracking and so on.
As we have previously delved into the details of Prometheus, Prometheus stands out as a prominent monitoring tool. Similar to all monitoring tools, Prometheus possesses both its strengths and weaknesses. This article, however, will concentrate exclusively on addressing one key limitation of Prometheus: its scalability. The reason for this specific focus is the multitude of queries and uncertainties developers frequently have about Prometheus' scalability. We intend to provide clear clarification in this regard.
What is the Scalability of the Monitoring System?
The scalability of a monitoring system refers to its ability to successfully handle increased workloads and growing needs. In essence, it refers to the system's ability to handle larger volumes of data, more resources, and higher traffic levels without sacrificing performance, responsiveness, or accuracy. A scalable monitoring system may adapt to changing situations, such as an expanding user population, newly monitored entities, or greater data flow while preserving efficiency and efficacy.
An Overview of Prometheus
Prometheus is an open-source monitoring and alerting toolset made for keeping tabs on the functionality, status, and metrics of software applications and systems. It has been designed with dynamic cloud-native environments and microservices architectures in mind. Prometheus collects metrics from a variety of targets, including services, servers, and applications, and retains the time-series data it has gathered. This data can then be examined, represented visually, and used to provide alerts depending on predetermined rules.
The Prometheus architecture is centred on its core server for data collecting, storage, querying, and alerting. Exporters provide metrics, while the Push Gateway handles transient jobs. The data is saved in a labelled time-series database. Alertmanager controls alerts, and Prometheus facilitates service discovery and relabeling. PromQL simplifies sophisticated queries, and visualisation tools like Grafana improve monitoring. The architecture is appropriate for dynamic systems, but scalability solutions such as federation and remote storage may be required.
Key Limitations of Prometheus:
Long-Term Storage: Not designed for long-term storage; hard to retain historical data.
Scalability: Extremely big environments with various targets or metrics are difficult to scale.
Lack of Native High Availability: Need external configurations for high availability, which influences system resilience.
Limited Multi-Tenancy Support: Multi-tenancy is not natively supported and requires additional configuration.
A global view of data – As mentioned earlier, individual Prometheus instances serve as standalone data stores. While federation is possible, it introduces complexity, and Prometheus
isn't inherently built for distributed databases. This hinders a simple path to achieving a cohesive, universal view of your time series data.
Authentication: Prometheus lacks built-in authentication measures, rendering its endpoints vulnerable without sufficient user validation.
Authorization: It lacks native authorisation features, which means that once access is granted, users have complete control over queries and data editing.
Scalability Options in Prometheus
In Prometheus, scalability is the capacity to manage an increasing number of monitored targets and metrics while maintaining effective performance and resource allocation. Prometheus has made improvements in terms of scalability, but it's important to realise its limitations and the best practices for growing successfully.
Prometheus embodies the following scalability options:
Horizontal Scaling: Prometheus may be horizontally scaled by installing additional Prometheus instances and dividing the workload across them. However, managing a distributed setup adds complexity, and you must guarantee that the data collecting and querying duty is evenly spread.
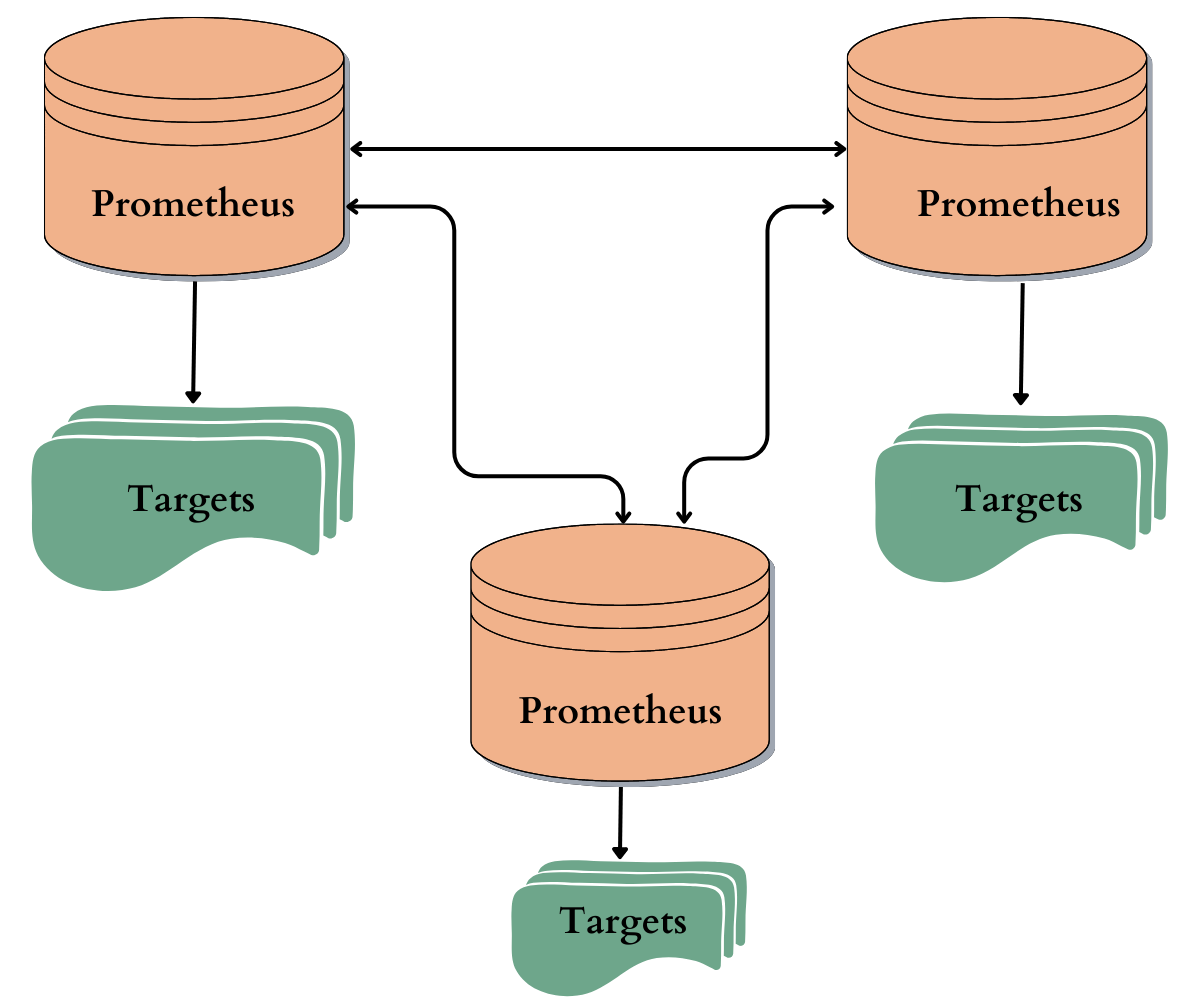
Federation: Federation is supported by Prometheus, allowing you to combine data from various Prometheus servers into a single one. Distributing the monitoring workload across many areas, teams, or services, can aid in scalability.
Use Cases of Federation:
Hierarchical federation: By utilizing hierarchical federation, Prometheus achieves scalability in environments encompassing numerous data centres and millions of nodes. In this scenario, the federation topology takes on a tree-like structure, wherein superior Prometheus servers gather aggregated time series data from a multitude of subordinate servers.
Cross-service federation: In the context of cross-service federation, a Prometheus server from one service is set up to selectively collect data from another service's Prometheus server. This configuration allows for alerting and queries that encompass both datasets within a unified server environment.
Limitations of Federation:
Latency and Overhead: Federation increases network communication overhead, which may result in increased query latency and resource utilisation. Remote instance availability and performance might have an impact on the overall monitoring system.
Complexity: Setting up and administering a federated setup can be challenging. You must verify adequate configuration, network access, and compatibility between Prometheus versions across instances.
Security Concerns: Federating data across distinct security domains may present issues in terms of safe communication, authentication, and authorisation between instances.
Scalability Challenges: The Federation can spread out the monitoring workload, but it doesn't naturally deal with the difficulties of managing very high numbers of targets and data.
Aggregation Complexity: Aggregating data from numerous Prometheus instances may necessitate complicated rules and setups to efficiently summarise and show the data.
Sharding
In some circumstances, sharding the monitoring workload based on various labels or dimensions might enhance scalability. This entails dividing the metrics data into numerous Prometheus instances according to specific parameters, which might lessen the strain on individual instances.
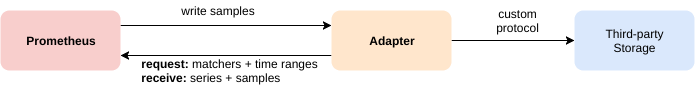
Remote Storage Backends
Prometheus supports several remote storage backends, such as Thanos and Cortex, to solve the restrictions of long-term storage. These technologies enable you to offload historical data to more appropriate storage systems while still querying and visualising the data.
While Prometheus presents diverse scalability choices, they may prove insufficient for exceptionally extensive environments with numerous targets and metrics. The complexities of scaling become evident in these situations, as existing solutions might not be suitably equipped to tackle the intricate challenges posed by such elaborate and sprawling ecosystems.
Consider the following example,
A Real-time Example of the Scalability of Prometheus
Prometheus has become a de facto standard for initiating monitoring in Kubernetes. There are sound justifications behind this trend: its open-source nature, unrestricted accessibility, and endorsement by the Cloud Native Computing Foundation (CNCF). Additionally, Prometheus was purposefully crafted to manage the inherently transient Kubernetes workloads. This positioning has propelled Prometheus to become the clear preference for those embarking on their first Kubernetes monitoring endeavours. However, running Prometheus at scale has proven difficult.
In a recent case, an organization managed a Kubernetes cluster of 500 nodes hosting numerous microservices monitored through Prometheus. To streamline the process and prevent engineers from accessing multiple Prometheus instances, they attempted to consolidate several Kubernetes clusters into each Prometheus instance. Initially, this approach worked effectively, but challenges emerged as the environment expanded beyond a few hundred nodes. The Prometheus servers became overwhelmed, resulting in extended query times and crashes. Furthermore, maintaining data beyond seven days became problematic due to cost constraints. Consequently, incidents older than a week remained undetected, and the ability to troubleshoot intricate issues spanning multiple weeks was compromised. Internally, there was debate about abandoning Prometheus and adopting an alternative solution. However, the developers were hesitant to alter their metrics collection methodology, and the potential transition posed significant challenges.
Rather than opting for an alternative, this organization chose to retain their Prometheus servers but adjusted the retention period to just four days. For requirements demanding extended retention, cross-environment insights, or sophisticated analytics, they turned to the supplementary tool, Wavefront.
Despite the numerous monitoring advantages Prometheus provides, its limitations in terms of scalability, long-term storage, high availability, global data visibility, and multi-tenancy have prompted developers to explore supplementary tools that are employed alongside Prometheus to address these challenges.
Let's explore those tools briefly.
Top 5 Scaling Tools for Prometheus with Pros and Cons
Thanos
Thanos is an open-source project that adds long-term storage and high availability to Prometheus. It enables the storing of historical data in object storage systems such as Amazon S3 or Google Cloud storage. Thanos has a query federation functionality that allows you to query multiple Prometheus instances and remote storage systems.
Pros:
Long-Term Storage: Enables retention of historical data beyond Prometheus' native capabilities using object storage systems like S3 or GCS.
High Availability: Provides query federation for data availability across multiple Prometheus instances and storage backends, enhancing reliability.
Efficient Querying: Optimizes query performance by distributing queries across multiple instances and storage systems, reducing latency.
Scalability: Addresses Prometheus' scalability limitations by distributing the monitoring workload and handling high-cardinality scenarios.
Data Retention: Offers cost-effective long-term storage for compliance, analysis, and auditing purposes.
Cons:
Complex Setup: Configuring various components (query, store, compact, sidecar) introduces complexity compared to the core Prometheus setup.
Resource Overhead: Additional components require proper resource allocation to ensure optimal performance.
Learning Curve: Effective use demands an understanding of Thanos components, configurations, and interactions with Prometheus.
Maintenance: Ongoing management is needed to maintain data consistency, optimal querying, and high availability.
Object Storage Costs: Storing historical data in object storage systems may incur additional costs.
Integration Challenges: Integrating Thanos may necessitate adjustments to monitoring workflows and alerting systems.
Compatibility: While designed to work well with Prometheus, Thanos might not support all features or integrations.
Cortex
Cortex is a multi-tenant, horizontally scalable Prometheus-as-a-Service solution. It enables you to distribute metrics collection and querying effort over numerous Cortex instances. It is intended for high cardinality scenarios and provides efficient long-term storage through the use of several backend storage systems.
Pros:
Scalability Across Nodes: Cortex facilitates distributing the monitoring workload across multiple instances, making it well-suited for handling extensive numbers of metrics and targets.
Multi-Tenant Support: Cortex enables various teams or projects to share one Cortex cluster while isolating their data. This streamlines resource management within intricate environments.
Effective Management of High Cardinality: Cortex is designed to efficiently handle metrics with numerous unique labels or dimensions, making it proficient in high-cardinality scenarios.
Extended Data Retention: Cortex seamlessly integrates with object storage systems, granting the ability to retain historical data beyond what Prometheus natively allows.
Enhanced Query Performance: Cortex employs mechanisms for query optimization and caching, yielding quicker response times for user queries.
Cons:
Complex Initialization: The setup and configuration of Cortex involve coordinating multiple components and interactions, potentially demanding specialized expertise and time investment.
Resource Overhead: Operating and overseeing numerous Cortex components can potentially lead to an increase in resource consumption, necessitating resource allocation optimization.
Initial Learning Curve: Familiarizing your team with the effective configuration and management of Cortex might involve a learning curve.
Continuous Maintenance: Like any distributed system, Cortex requires ongoing attention to ensure consistent performance, data availability, and high availability.
Integration Complexity: Integrating Cortex into an existing Prometheus ecosystem may necessitate modifications to monitoring workflows and alerting systems.
Compatibility Considerations: Although Cortex strives for Prometheus compatibility, certain differences in behaviour or feature support could arise.
Customization Efforts: Adapting Cortex to specific requirements may involve development efforts and intricate customizations.
VictoriaMetrics
VictoriaMetrics is a Prometheus-compatible time-series database that is fast, cost-effective, and scalable. It is intended for long-term storage and fast querying of time-series data. It supports many storage backends, including local and remote object storage.
Pros:
Speed and Efficiency: VictoriaMetrics is optimized for fast performance and efficient resource utilization, ensuring quick query responses and minimal resource consumption.
Scalability: It offers horizontal scalability to accommodate increasing workloads, making it a suitable choice for environments with expanding metric counts and targets.
Long-Term Data Storage: VictoriaMetrics supports extended data retention, allowing historical data storage beyond the capabilities of standard Prometheus setups.
Compatibility: With Prometheus compatibility, VictoriaMetrics integrates smoothly with existing Prometheus systems, facilitating migration and adoption.
High Cardinality Handling: The platform efficiently manages metrics with high cardinality, ensuring robust performance even in cases with numerous distinct labels.
Cons:
Learning Curve: Implementing and configuring VictoriaMetrics may require some learning for teams accustomed to Prometheus setups, due to potential differences in setup and administration.
Feature Variability: While VictoriaMetrics strives for Prometheus compatibility, certain advanced or specific Prometheus features may vary or necessitate adaptation.
Complex Customization: Customizing VictoriaMetrics for specific needs could involve intricate customization efforts.
Maintenance: Ongoing upkeep is essential to sustain optimal performance, scalability, and data availability.
Resource Planning: Properly allocating resources is pivotal to harness the advantages of VictoriaMetrics' performance and scalability.
Integration Complexity: Introducing VictoriaMetrics into an existing Prometheus ecosystem may demand adjustments to workflows, monitoring tools, and alerting systems.
M3DB
M3DB is a time-series database that may be used as a backend for Prometheus. It is distributed, scalable, and dependable. It has automatic sharding, replication, and a global namespace for storing metrics.
Pros:
Distributed Scalability: M3DB facilitates the distribution of monitoring workloads across multiple instances or nodes, making it effective for managing substantial metric volumes and targets.
Automated Sharding: M3DB automatically divides data into shards spread across the cluster, ensuring consistent performance as data scales.
Unified Metric Namespace: With a global namespace, M3DB simplifies metric management across different teams, services, or projects.
Optimized Storage: M3DB's design prioritizes efficient time-series storage, allowing extensive historical data retention without compromising query speed.
Efficient Querying: M3DB delivers efficient querying capabilities, enabling swift retrieval of metric data.
Cons:
Complex Configuration: The setup and configuration of M3DB can be more intricate compared to conventional Prometheus setups, involving the management of multiple components and configuration aspects.
Learning Curve: M3DB's distributed architecture and specific setup requisites might necessitate additional learning for teams accustomed to Prometheus.
Ongoing Maintenance: As with any distributed system, M3DB mandates ongoing upkeep to ensure steady performance, data availability, and high availability.
Integration Challenges: Integrating M3DB into an existing Prometheus environment may entail adapting monitoring workflows and alerting systems.
Resource Demands: Managing a distributed system like M3DB introduces supplementary resource requirements that must be managed thoughtfully.
Compatibility Considerations: While M3DB aims to align with Prometheus' data model and query language, certain differences or limitations may require attention.
Grafana
Grafana, which is largely a visualisation and dashboarding tool, can also help Prometheus scale. It can assist you in monitoring and visualising Prometheus instance performance, query latency, and resource utilisation.
Pros:
Versatile Visualization: Grafana excels in offering a wide array of visualization possibilities, enabling the creation of customizable dashboards to showcase metrics and data diversely.
Integration with Multiple Data Sources: Grafana seamlessly integrates with various data sources beyond Prometheus, allowing the consolidation of data from diverse monitoring systems into a unified dashboard.
Alerting Capabilities: Grafana features built-in alerting functionalities, empowering users to establish alerts and notifications based on metric thresholds.
Robust Plugin Ecosystem: Grafana boasts an extensive library of plugins and extensions that enhance its functionality, enabling the inclusion of supplementary data sources, visualizations, and more.
User-Friendly Interface: Its user-friendly interface renders it accessible to a broad user spectrum, enabling dashboard creation and interaction without demanding profound technical expertise.
Cons:
Complexity in Advanced Configurations: Although Grafana's interface is user-friendly, intricate configurations or customizations can become intricate, necessitating a solid grasp of the tool's underlying mechanisms.
Resource Consumption: Depending on dashboard complexity and quantity, Grafana's resource utilization can be substantial, potentially affecting overall system performance.
Learning Curve for Complex Use Cases: For intricate scenarios involving data transformation, querying multiple sources, and advanced alerting, a learning curve might be involved.
Dashboard Management: Effectively managing a substantial dashboard count can be challenging, demanding meticulous planning for organization and upkeep.
Native Data Storage Absence: Grafana lacks inherent data storage capacities, relying on external sources like Prometheus for storing and querying metric data.
Alerting Limitations: While Grafana's alerting features are valuable, they might not match the comprehensiveness or sophistication of dedicated alerting tools.
Summary
Prometheus has brought about a significant transformation in the monitoring realm for cloud-native applications, especially within the context of Kubernetes. It facilitates the straightforward ingestion of metrics for various components of your software stack.
Nonetheless, even sizable tech enterprises encounter difficulties when it comes to effectively managing and scaling Prometheus.
Regrettably, a basic Prometheus setup comes with constraints. As your operations expand and scalability becomes essential, Prometheus fails to provide a unified view encompassing all your metrics (not to mention traces and additional observability data), steadfast data retention, advanced analytical capabilities, intelligent and adaptable alerting, or an intrinsic configuration for high availability.
To streamline this intricate process, organizations should contemplate adopting a managed Prometheus solution. This solution offers ready-to-use features that facilitate Prometheus monitoring and scalability, all while maintaining compatibility with open-source standards such as Thanos, Cortex, Grafana and so on.


Comments
Post a Comment