Debugging PHP code using Xdebug

To produce a seamless effective result, you must consider a few aspects when creating web applications. When building strong apps, good developers adhere to development best practices such as testing, debugging, etc.
Debugging is a vital stage in the creation of any app because it validates that the written code will function as intended. When we write long lines of PHP code and an error arises, fixing the error may prove to be a difficult effort. Bugs are a pain and Debugging is their painkiller. Detecting and fixing the bugs is a time-consuming process of development. So developers need an efficient debugging tool namely Xdebug.
Many PHP debugging techniques can save you countless hours of coding time. Turning on error reporting is a straightforward method, and utilising the print statement is a little more complex one.
Xdebug is the PHP extension for debugging PHP scripts providing a variety of useful debug data. In addition to protecting against infinite recursions and memory allocation, it also includes function traces and stack traces in error messages. If you combine it with an IDE, you can use this fantastic debugging addon more effectively.
You could just use dump debugging methods like an error log, print, and var_dump( ) to troubleshoot your PHP code; We've all done it a lot! While occasionally useful, they frequently need to catch up and may even cause you to progress more slowly. Surely you must need a better approach! Here, Xdebug is a better approach for better debugging.
In this article we are going to explore Xdebug, debugging PHP code using Xdebug and features of Xdebug with playground examples. Let’s explore the content!
What is Xdebug?
Xdebug is a PHP extension that aids developers in debugging and streamlining the development of their projects so they can look out for and fix issues. Stack traces for notifications, warnings, errors and exceptions are added, and the PHP var_dump() function is upgraded.
Xdebug provides debugging and profiling capabilities while utilising the DBGp debugging interface. We can add breakpoints and halt the execution of the code at each breakpoint to see the output of the variables in a single iteration of the function.
You can thus avoid wasting time on code debugging by using Xdebug instead. To see the output once more without Xdebug, you must reload the page. To identify the method that is having problems, you can also set breakpoints independent of that method.
Also, you can create as many breakpoints as you like and utilise a PHP debugger to examine each line of code individually.
Debug Driven Development
Using Xdebug proactively during development as opposed to responding to already-existing code problems is yet another excellent usage for it. Similar to Test-Driven Development (TDD), but with the debugger being used initially rather than tests. I'm not sure if the phrase "Debug Driven Development" (DDD) is widely used, but for me, I've utilised Xdebug to assist me in writing new code in a few different ways:
Examine existing arrays, objects, and class instances to discover the information I can utilise in my new code.
Debug freshly written code right away to make sure it functions as intended.
Set up Xdebug in PHP
It's time to set up Xdebug in PHP right now. You have a few choices on how to install Xdebug.
Windows
For Windows users, Xdebug offers a wizard application that allows you to obtain the necessary.dll file. Create the following PHP file in the folder and add the following line of code to accomplish this:
<?php
phpinfo();
?>
Open up the file in your browser. The PHP information will be displayed. Copy the information, paste it into the wizard tool, and then select the Analyze my phpinfo() result option.

You will receive the following output as a result:
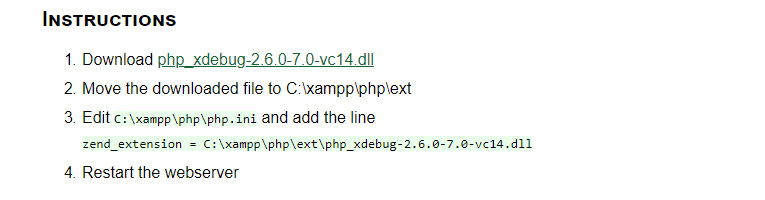
Now, download the.dll files and add the files to the xampp/php/ext directory by following the aforementioned procedures. The web server should then be restarted after completing step 3 to enable Xdebug in the php.ini file.
MAC
With the pecl extension, PHP7 Xdebug may be installed:
pecl install xdebug
Linux
When using a Linux distribution like Debian, you can install Xdebug in PHP using sudo:
sudo apt install php-xdebug;
Now, open the file etc/php/7.0/mods-available/xdebug.ini and add the following code to enable Xdebug:
xdebug.profiler_enable_trigger = 1
xdebug.profiler_enable = 0
xdebug.remote_enable = 1
xdebug.profiler_output_dir = "/tmp"
Now, restart the Apache2 server.
sudo service apache2 restart;
Set up Xdebug in VSCode
If you want Xdebug to work well, you can incorporate it into your preferred IDE, such as phpstorm, Zend studio, and VScode. Let's set up Xdebug in Visual Studio Code to troubleshoot PHP.
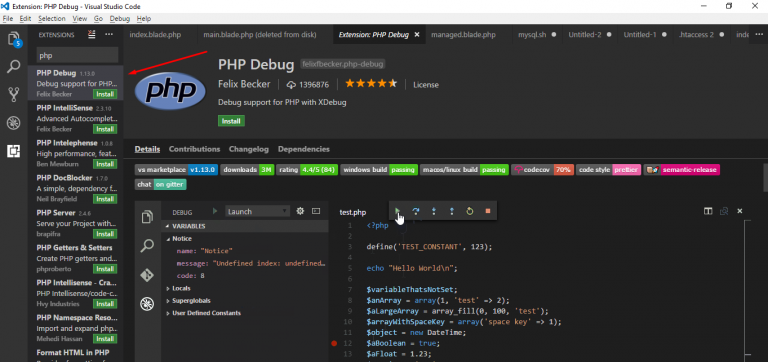
A widely used PHP extension for VSCode is php debug. You can discover it and install it in the extension window.
You must reload the VSCode window after installation. Run the phpinfo(); method in any PHP file once more to see whether Xdebug is active or not.
Next select Add Configuration from the Debug Console menu.

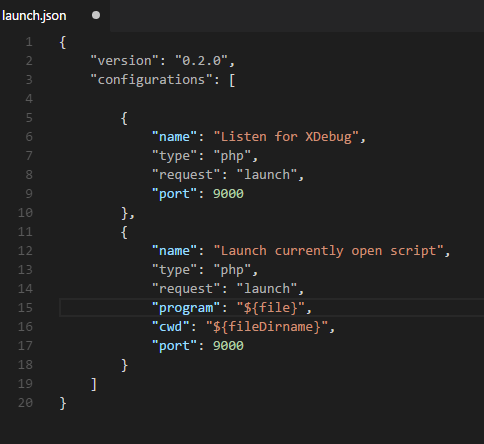
You now need to choose the PHP environment. A launch.json file will now be added by VSCode to the root directory.
Finally, after the port, add the runtimeExecutable attribute to the list:
"runtimeExecutable": "C:\\xampp\\php\\php.exe"
Launch.json should be saved. To start the debugging option, open the debug mode tab and select the green debug button.
Now, a few options will appear in the window, allowing you to choose the type of logs that Xdebugger will display:
Notices
Warnings
Errors
Exceptions
Everything
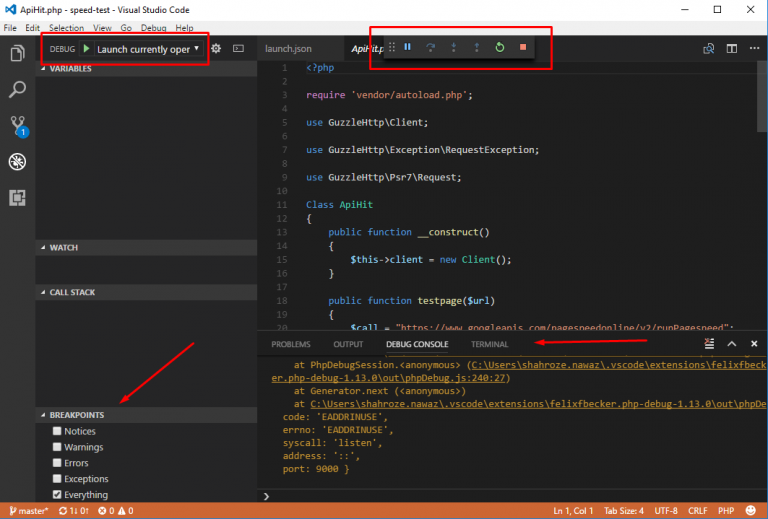
Go to the Debug Console section, where the debug execution buttons are located at the top and details of bugs are displayed.
You can now place breakpoints on the lines of code that need fixing. On the bottom left section, Xdebug will add the name of the PHP debug script along with the line number:

To identify the bugs and effectively troubleshoot them, you can launch the application in the browser while reading the code line by line. You should also remember a few shortcut keys for moving between functions and lines of code:
F5: Continue Debugging
F10: Step Over
F11: Step into
Shift + F11: Step out

Features of Xdebug with playground examples

A method for stepping through your code in your editor or IDE while the script is running.
An enhanced var dump() function, stack traces for Notices, Warnings, Errors, and Exceptions to emphasise the code path to the error.
writes every function call, together with its parameters and location of invocation to disk. Also includes every variable assignment and return value for each function, if applicable.
enables you to analyse the performance of your PHP application and identify bottlenecks with the aid of visualisation tools.
To display which sections of your code base are processed while PHPUnit runs unit tests.
Just tap the links to explore the real-time examples of features of Xdebug.
The End
With debugging, you can figure out where your code went wrong. Debugging is a crucial part of programming. Therefore, it is a good idea to set up your debugging environment before starting the code-writing process, as you will undoubtedly need a PHP debugger if you are creating a complex application with thousands of lines of code to identify errors and warning signs well in advance of the delivery date.
It's no longer necessary to use debugging tools like print r, echo, and var dump. There are excellent tools available for PHP developers that wish to take their craft seriously and cut down on the time they spend looking for bugs to the bare minimum.
In development environments for instance VS code, PhpStorm, etc., Xdebug is frequently enabled because it does provide additional details about what occurs when things go wrong. Xdebug also has a strong step debugger that is necessary for troubleshooting the trickiest problems in a PHP project. You can now quickly identify performance bottlenecks in your code using Xdebug profile mode.
The majority of users find that utilising Xdebug when using an IDE for coding is the best and most user-friendly method of debugging. The PHP extension Xdebug offers a single-step debugger that you can use with an IDE like VS code to aid with development and debugging.


Comments
Post a Comment